

Overview
"Morning! Sara here again. My beloved children, every Saturday, go to the center of town to sell Lemonade and Orange juice. They've set up their own stand. John prepares the juices in my kitchen, Leila is riding her bike every hour, taking the fresh juices to the stand, where Theodore is selling the juices."
Stock Buffers
The stock buffer intention is to protect against shortages (in contrast to time buffer that protects against tardiness).
A stock buffer is defined per item per stock location (any place that keeps stock, virtual or actual).
The stock buffer size is the number of units one would like to keep overall in the supply chain (for a certain stock keeping unit, and a certain stock location).
In our example, the dear children defined a buffer for the lemonade cups, and for the orange juice cups.
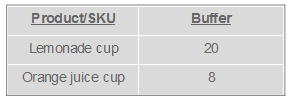
This buffer, eventually, will help us to determine how many cups to prepare and to prioritize the cup making. Let's see what is the meaning of "buffer equal to 20" for the lemonade cups: The children have decided that in every given moment there should be 20 lemonade cups in the whole supply chain. The supply chain here includes the cups in the stand, the cups on the bike on their way to the stand, and the cups in the kitchen that are in preparation.
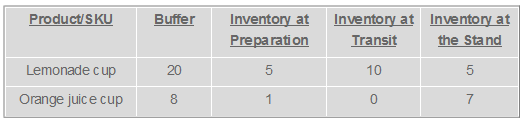
This is the present inventory situation:
Replenishment
The replenishment quantities should equalize the quantity in the entire supply chain with the stock buffer value. For example, until Leila will reach the stand and deliver the cups, few more cups will be consumed: By the time the 10 Lemonade cups will be brought to the stand, 3 more cups will be consumed from the stand. The new inventory at the stand will be 5-3+10=12. In the meantime, still, the 5 cups are in preparation. Now, the total supply chain contains 12+5=17 cups. Leila picks up the phone and lets John know he needs to prepare 3 more cups.
Item's Urgency
The easiest and fastest visual indication for most people is color-based. As a Traffic light that gives the warning: Go / Stop in such an intuitive way by color, Onebeat utilizes color as a decision support system.
Every item, in every given time, has its color. There are three colors, exactly like in a traffic light: Red, Yellow, and Green. two additional colors are used when the situation deviates severely from the desired. First, as if our traffic light has suffered from an electrical power interruption: The color to be used in those situations will be Black which will indicate that there is a shortcut. The other color will be Cyan, which will indicate that we are overstocked.
Black WOs - Most urgent - shortage.
Red WOs - Very urgent - Very low inventory.
Yellow WOs - We're OK.
Green WOs - We have time, don't worry - High inventory.
Cyan WOs - We are overstocked.
The second prioritization mechanism within the same color is done by Buffer Penetration or BP. The BP value also determines the buffer color be used.
Buffer Penetration
We need a tool to detect a product's urgency (the color) or to prioritize between the different products. The tool that fulfills the mentioned requirement is called Buffer Penetration - or BP.
The BP is an urgency index. The term Buffer Penetration represents its meaning - penetration to the buffer - or in other words, what portion of the buffer has already been spent.
The general formula of BP is the following:

The deeper the penetration into the buffer is, the more urgent the item is.
The extremities are the easiest to understand: 0% BP represents that the inventory is equal to the buffer. 100% of BP represents a shortage. Negative BP represents that the inventory is greater than the buffer.
Where usually:
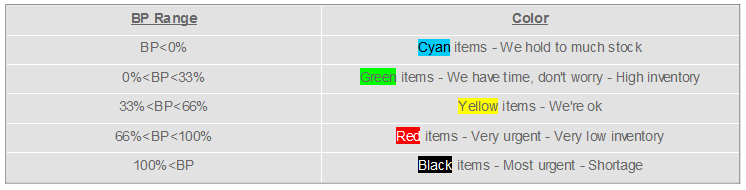
In exceptional cases, the matching between the colors and the BPs can be different. For example a bread store. The red BP could be defined as 90% - 100% because the inventory at the end of the day should be very low.
Virtual BP
They are three different perspectives of BP which are referred to as Virtual BP. Those views are BP at Site, BP at Transit and BP at Production. Every BP represents the urgency level in a specific place in the supply chain.
The regular BP is the BP Site. It calculates the portion of the buffer that has been spent already, referring only to the quantity that is at site right at present (in our example, at the stand).
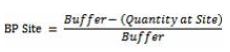
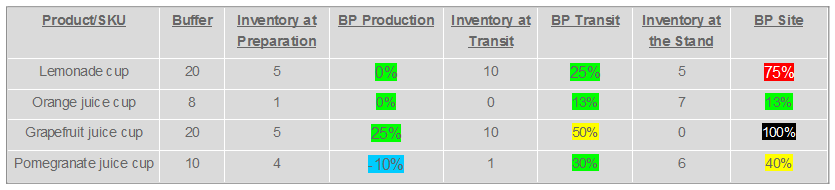
So, if the buffer for Lemonade cups is 20, and right now at the stand there are 5 cups, the BP at site = (20-5) / 20 = 15 / 20 = 75%.
The Virtual buffer at transit is the BP Transit. It is a different view on the same buffer. This BP includes not only the quantity at site, but also the quantity at transit. It shows the urgency for the next position in the chain - the production.

So, if the buffer for Lemonade cups is 20, and right now at the stand there are 5 cups, and in transit there are 10 more, the BP Transit = (20-(5+10)) / 20 = 5 / 20 = 25%.
The BP at transit is based on the assumption that these units will arrive soon, and asks the question: how much do we need to expedite the production? In this case, the situation is fine. The BP Transit is green and there is no need to expedite the production.
The Virtual BP at production is BP Production. This point of view also includes the quantity at production:

So, if the buffer for Lemonade cups is 20, and right now at the stand there are 5 cups and in transit there are 10 more, and in production there are 5 more, the BP Production = (20-(5+10+5)) / 20 = 0 / 20 = 0%.
This represents the urgency for replenishment. 0% BP Production shows that in the whole supply chain we have the exact number of units that should be. Therefore, in this case, there is no need to start producing more.
Let's see more examples:
Comments
0 comments
Please sign in to leave a comment.